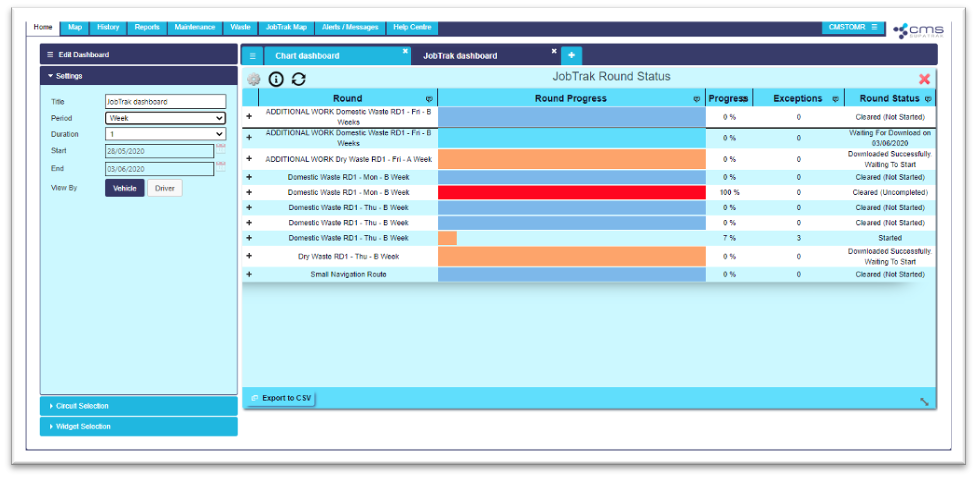
After adding the JobTrak dashboard, users can view exception details by clicking the ‘+’ sign next to a round to show the zones within.
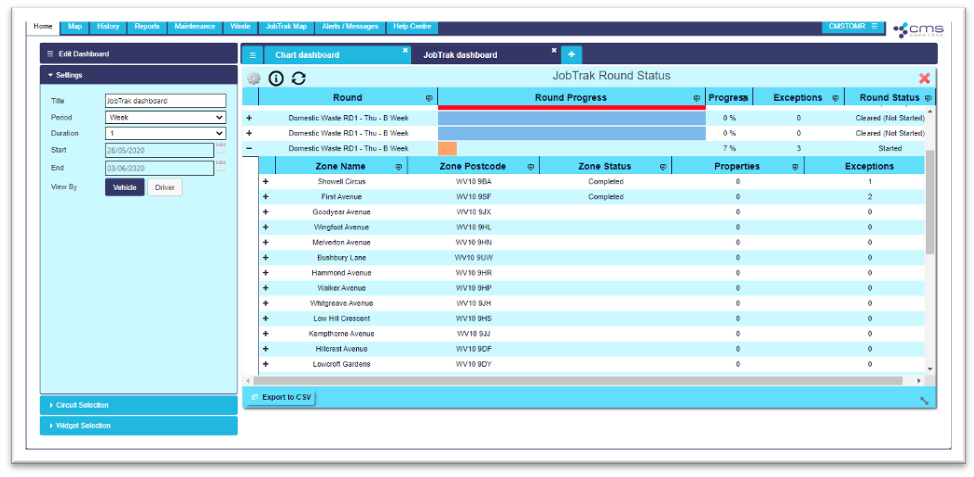
Zones that have exceptions logged can then be expanded by clicking the ‘+’ sign next to the ‘Zone Name’.
After adding the JobTrak dashboard, users can view exception details by clicking the ‘+’ sign next to a round to show the zones within.
Zones that have exceptions logged can then be expanded by clicking the ‘+’ sign next to the ‘Zone Name’.